ATO Taxation Statistics
The ATO recently released its “Taxation Statistics” from the 2021 financial year. While the data is now 2 financial years old, it still provides some interesting reading and analysis. Here is some of the data that we found the most thought-provoking.
Individuals – Top 10 Occupations, by Average Taxable Income
Individuals – Top 10 Postcodes, by Average Taxable Income
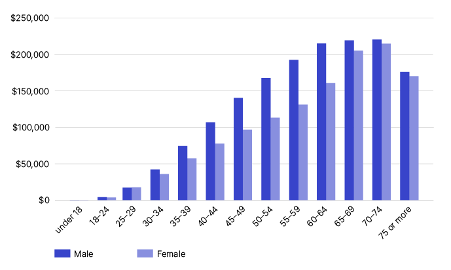
Individuals – Median Super Balance, by Age and Sex, 2020–21 Financial Year
This graph provides the medium of the super of men and women as at 30th of June 2021. While the data is a little old, it may assist some in understanding how they are tracking, compared to others in their age bracket. If you are not happy with your super balance by comparison, please book a complimentary appointment with one of the financial planners at Salt to discuss what strategies may be available to get you ahead of the curve.
Individuals – Rental Income and Deductions, 2016–17 to 2020–21 income years
In 2021 at least 2.2 million Australians had ownership of at least one rental property and 20,000 Australians owned 6 or more rental properties. In the graph above, the purple line indicates that net income received from rental properties increased significantly, which is generally a sign of higher rental rates being charged to tenants and lower interest costs. Something to keep an eye on in the future is the composition of this graph and table, as interest rates have increased significantly in the years following this data. If you are wanting to understand the impact of interest rate increases as it relates to your tax outcome, or understand if your rental property is still the right investment for you, please contact Salt to speak to one of our advisers.


